


Buy the Dip Generation
Market Driver: Risk Premium

Investors usually weigh risk and reward and a typical measure is risk adjusted return. The simplest model can be expressed as the difference between the expected return and the risk free rate, available in the form of treasury bills/notes/bonds. An investor seeks the appropriate yield based on their risk appetite.
The current 2024 market earnings per share is ~245, pricing in ~11% growth relative to 2023 roughly matching the June SEP, sustained by nominal GDP growth. The broad market risk premium is close to zero with SPX trading around 4500. Using the expected earnings per share of 2023 and 2024 being 220 and 245 respectively, this translates to ~20.5x P/E and ~18.4 P/E. The 3 month treasury bill (Tbill) yields 5.4% while the 10yr yields 3.8% at the time of writing.
Oversimplifying yield assessment, an investor can choose to park their cash in the broad market which is (maybe optimistically) expected to yield 5.4% over the next year based on forward earnings expectations or risk free government Tbills. For the risk averse, it is not a hard decision to park cash in the latter when the yield expectations are equal and there is minimal risk. One can argue longer durations 2yr-10yr are rich relative to Tbills as well.
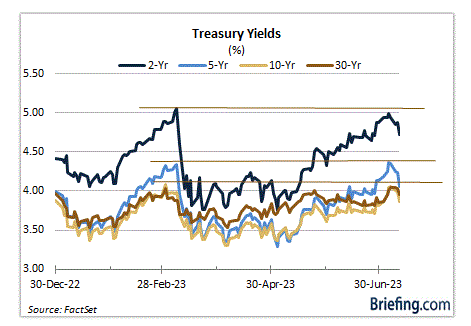
It is worth noting the yield curve is likely to remain inverted until Chair Powell thinks a loosening stance is appropriate, whether it is from substantial negative change in NFP trajectory or real rates being too high to neutral. The inversion should be treated as a signal for caution and fragility of markets, rather than a leading indicator for doom.

Source: https://www.yardeni.com/pub/peacockfeval.pdf

Source: https://www.longtermtrends.net/market-cap-to-gdp-the-buffett-indicator/


Based on this evaluation one might say the market is expensive, especially as a substantial portion of the market is held up by large cap technology companies that have rebounded back near their all time highs despite 500 bps of hikes. The chart below shows the relationship in the past. Based on this aggregate, P/E’s have averaged around 18x in the past when the 10yr is ~4%. It’s worth noting during the 90s, multiples expanded with the onset of a general purpose technology that increased productivity exponentially in the dotcom era. With Microsoft’s increased stake in OpenAI in late January, the underlying market driver trend of the next decade has sparked. In addition, profit margins look different.


Source: https://am.jpmorgan.com/us/en/asset-management/adv/insights/market-insights/guide-to-the-markets/

One additional factor is demographics. The chart below shows that Millennials are coming into their prime earning years and are in the accumulation of wealth phase. Millennials are the buy the dip generation. Whether it’s equities with bimonthly 401k contributions or housing trying to provide shelter for their family or alternative investments aimed at disruption, Millennials are seeking ways to amass wealth. With 30 year horizons, Millennials have a big risk appetite. NYU Professor Damodaran has shown evidence of the correlation between risk premium and investor age in the blurb below.

Source: The Compound & Friends #26


Source: https://pages.stern.nyu.edu/~adamodar/
The push and pull between choosing risk assets can also be shown with the correlation between Nasdaq and the 10y, which has dropped back into negative territory. Worth noting is the correlation changes shown relative to inflation trends. It is worth reiterating that over the past 6 months, there has been a weird paradox of forward pricing. Every time the bond market prices recession, it stimulates the real economy with lower long end yields and holds off the recession.
Positioning into the SVB saga while chatgpt was being introduced was a major reason in how large cap technology shorts were unwound in Q1 2023. Furthermore, the equity market has focused on earnings while the bond market has focused on leading economic index (LEI) for pricing, diverging in narratives.


In summary, this market is a mere opportunity to accumulate for millennials. Millennials pulled out a compounding calculator for 30 year horizons and have been unfazed by this market. Funds that were touting cash is king have underperformed the broad market and at some point people are likely to realize they have run out of negative excuses to short the market. Hedge funds just lost a significant portion of their gains from their profitable Jackson Hole short in 2022. The narratives that have been dismissed include the following:
Labor shock was coming
Banks were failing
Credit crunch was coming
AI effects were too early to justify valuations
Debt ceiling/TGA rebuild was going to cause bond market turbulence
Earnings were/are going to disappoint
While valuations have stretched high for the overall market, the large technology companies are fundamentally different from the companies in the dotcom era and there is always opportunity to be found with them anchoring the market if nominal GDP growth is sustained. The market participants that caught the Christmas low have no reason to sell and only seek opportunities to add positions after trimming profitable trades. The 1H underweight/short positioning has forced some funds to buy at price levels they do not want to buy.