


Deja Vu, but AI to the Rescue? Part 4/5
Market Driver: Risk Premium


Jackson Hole came and went. A year has passed and not much has changed from the Fed perspective. Market participants are still debating inflation and interest rate paths, despite headline CPI getting halved with unemployment barely budging. People are forecasting recession again within the next 6-9 months. Deja Vu.
I will attempt to break it down in terms of five market drivers that I have focused on in the past.
Let’s continue with the risk premium and AI continuing its attempt to overpower discount rates:
The current 2024 market earnings per share is ~248, pricing in ~12% growth relative to 2023 roughly matching the June SEP, sustained by nominal GDP growth from real wages and net interest income. The broad market risk premium is close to zero with SPX trading around 4458. Using the expected earnings per share of 2023 and 2024 being 221 and 248 respectively, this translates to ~20.2x P/E and ~18.0x P/E. The 3 month treasury bill (Tbill) yields 5.5% while the 10yr yields 4.3% at the time of writing, translating to ~18.2x P/E and 23.3x P/E.
Oversimplifying yield assessment, an investor can choose to park their cash in the broad market which is (maybe optimistically) expected to yield 5.5% over the next year based on forward earnings expectations or risk free government Tbills. For the risk averse, it is not a hard decision to park cash in the latter when the yield expectations are equal and there is minimal risk. One can argue longer durations 2yr-10yr are rich relative to Tbills as well.
It is worth noting the yield curve is likely to remain inverted until Chair Powell thinks a loosening stance is appropriate, whether it is from substantial negative change in NFP trajectory or “real” rates being too high to “neutral”. The inversion should be treated as a signal for caution and fragility of markets, rather than a leading indicator for doom.

Source: https://www.longtermtrends.net/market-cap-to-gdp-the-buffett-indicator/

Source: https://www.yardeni.com/pub/peacockfeval.pdf

Source: https://www.investing.com/rates-bonds/usa-government-bonds

With how market inflation breakevens and credit spreads behaved, it is likely that the long end upward pressure was purely supply, caused by the combined effects of China/Japan and Secretary Yellen’s QRA. Although China troubles and the BoJ created the rise on 10yr yields, these pressures have their limits. The long end is dictated by Secretary Yellen’s issuance composition and that lever is up to her to exercise and she could just as easily reduce the tightening from QT. The short end issuance had been draining the Reverse Repo up until the recent QRA.
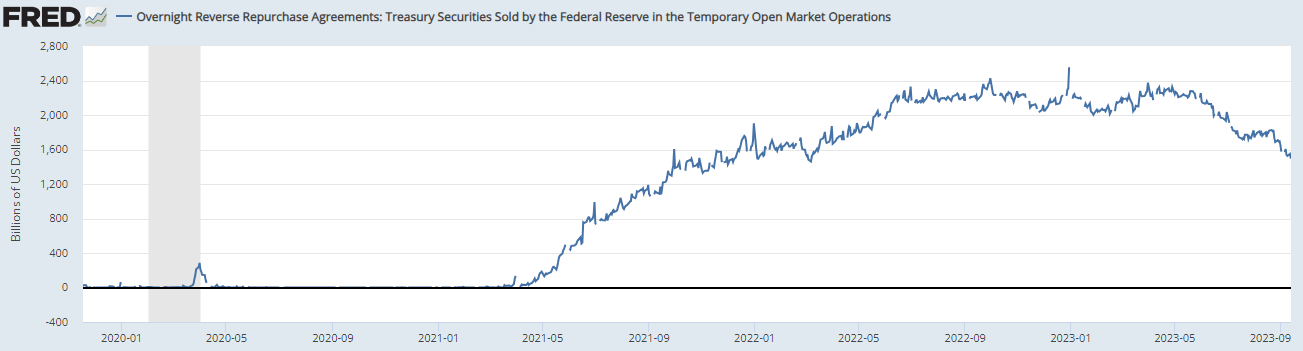

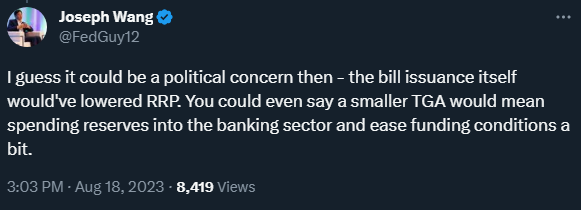
Source: https://twitter.com/FedGuy12/status/1692658465955565677?s=20
With an election year and one of the most important capex cycles, it is probably worth noting what Treasury Secretary Yellen thinks about technology and productivity:

Source: https://www.frbsf.org/economic-research/publications/economic-letter/2005/february/productivity-and-inflation/#subhead2
You can make the argument that soft landing is fully priced in here, but is AI? I think it’s worth reiterating that demographics and AI are two major tailwinds for equities. Market seems to have digested the 10yr at 4.1-4.3% relatively fine. If you think AI is just hype (6 month timeframe), you probably also think the gap between Nasdaq and the long end of the yield curve should be closing soon.

Here’s a gap that didn’t really close. Choose your fighter. I think AI beats oil. What does the market think?

How fast productivity gains are realized from LLM + code API enterprise deployment remains key:
Business expenditures dictated by fiscal policy and spurred by innovation
Corporate profit margins holding due to productivity gains outpacing capital expenditure
Global demand for US innovation and products

Source: https://twitter.com/LizAnnSonders/status/1699771338368389301

Source: https://am.jpmorgan.com/us/en/asset-management/adv/insights/market-insights/guide-to-the-markets/
In summary, this market is a mere opportunity to accumulate for millennials. Millennials pulled out a compounding calculator for 30 year horizons and have been unfazed by this market. Funds that were touting cash is king have underperformed the broad market and at some point people are likely to realize they have run out of negative excuses to short or sit out the market. The narratives that have been dismissed include the following:
Labor shock was coming
Banks were failing
Credit crunch was coming
AI effects were too early to justify valuations
Debt ceiling/TGA rebuild was going to cause bond market turbulence
Earnings were/are going to disappoint
Duration supply from China/Japan and Treasury Issuance
While valuations have stretched high for the overall market, the large technology companies are fundamentally different from the companies in the dotcom era and there is always opportunity to be found with them anchoring the market if nominal GDP growth is sustained and AI provides tailwinds for productivity growth in every sector.
The market has digested the 10yr trades between 4.1-4.3%. The push and pull between the underlying supply and demand for the long end of the yield curve is something that needs to be monitored on a week to week basis, but I am of the opinion that the market will push higher with the 10yr less than 4.5%. There are headwinds to the US consumer and it is taking the form of higher borrowing costs, depletion of excess savings and student loan payments
It is important to remember soft is the easy part. It is keeping it soft that is the hard part and containing the spike in unemployment. The longer the Fed can maintain this rate, the more bullish it is for the US economy as Chair Powell can choose to slowly ease and maintain real rates as NFP rolls over. There is an argument to be made that it is priced in at current index levels.
The market is trading like the economy is in the early phase of a new business cycle.


Source: https://digital.fidelity.com/prgw/digital/research/market

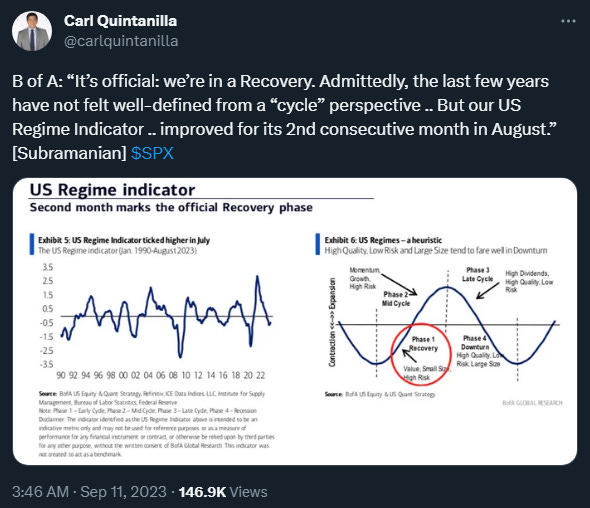
Source: https://twitter.com/carlquintanilla/status/1701185531906851055?s=20