


Buy the Dip. Ueda Style
Market Drivers: Risk Premium and Price

Nikkei published Bank of Japan (BoJ) news 7/28/2023 2:01AM JST that gave the market a quick jolt. Major indices rolled over as the 20+ year Treasury Bond ETF (TLT) slid further from its opening range that was already in the red from a smoking hot GDP print, which the GDPNow tool nailed.
Once the decision was announced, major indices reversed.

https://asia.nikkei.com/Economy/Bank-of-Japan/BOJ-to-discuss-yield-curve-control-tweak-to-allow-rates-over-0.5

The BoJ decision can be visualized as follows

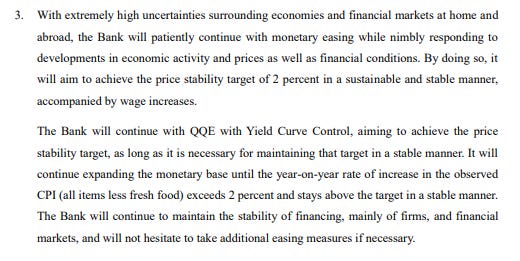
Source: https://www.boj.or.jp/en/mopo/mpmdeci/mpr_2023/k230728a.pdf
Oversimplifying the dynamics, I think the market tried to price in the risk of Governor Ueda removing the cap, which did not happen. The BoJ decision is still a big deal, as it implies the eventual end of their yield curve control (YCC) policy.
Andy Constan provides a great explanation of valuing the Japan Government Bond (JGB) compared to the US Treasury (UST) 10 year yields with Mrs. Watanabe.

Source: https://twitter.com/dampedspring/status/1684925323186487296?s=20
Moving forward, this is a key factor to monitor with respect to risk premium. The decade of ultra-low interest rates punished Japanese domestic savers and incentivized money to go overseas. This changes that dynamic. It likely won’t be immediate, but it’s a gradual transition process and provides upside risk to 10yr yields.


Source: https://www.bloomberg.com/news/articles/2023-03-30/boj-s-ueda-could-shake-global-financial-markets-by-changing-kuroda-policy#xj4y7vzkg
Robin Brooks (@RobinBrooksIIF) predicted the current scenario in January 2023.

Source: https://twitter.com/RobinBrooksIIF/status/1615275084402360320?s=20
It is important to keep in mind Governor Ueda can still exercise discretion between 50 and 100 bps to control rate movements, although the cap has been lifted. It is likely that the JGB will remain bid, especially as BoJ tries to mitigate losses for JGB holders

Source: https://twitter.com/FedGuy12/status/1583054228972765189?s=20
Although the BoJ forecasts provided upward revisions to their CPI forecasts, Governor Ueda will likely continue to provide support for JGB in the next six months. This is the same Governor Ueda that joked about lag and effects of monetary policy being at least 25 years just one month ago.
https://www.c-span.org/video/?529021-1/federal-reserve-chair-european-central-bank-forum
Timestamp: 38:37
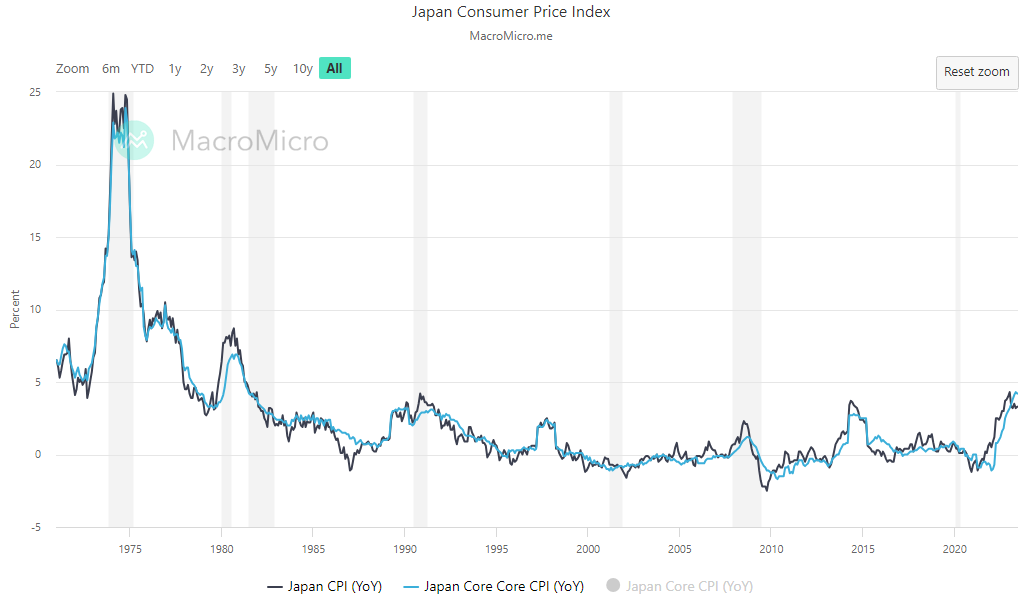
Source: https://en.macromicro.me/collections/49/jp-price-relative/681/jp-cpi

Source: https://www.boj.or.jp/en/mopo/outlook/gor2307a.pdf
Coming back to US markets. The long end of the yield curve also reflects inflation expectations, which are currently anchored in believing the Fed forecast of returning to target over time.

Source: https://twitter.com/JosephPolitano/status/1679120947813445634?s=20
People debating Jackson Hole and the September FOMC are overlooking that the pause already happened for the economy two months ago. 30yr mortgage rates have remained the same for the past two months as the summer housing market winds down. Homebuilders have inched up their buy down rates as new build prices have come down, and the housing market is set to slow into the second half of the year as the school year starts. Landlords are focusing on retention and occupancy this year, just as vacancies creep up with new apartments coming online.

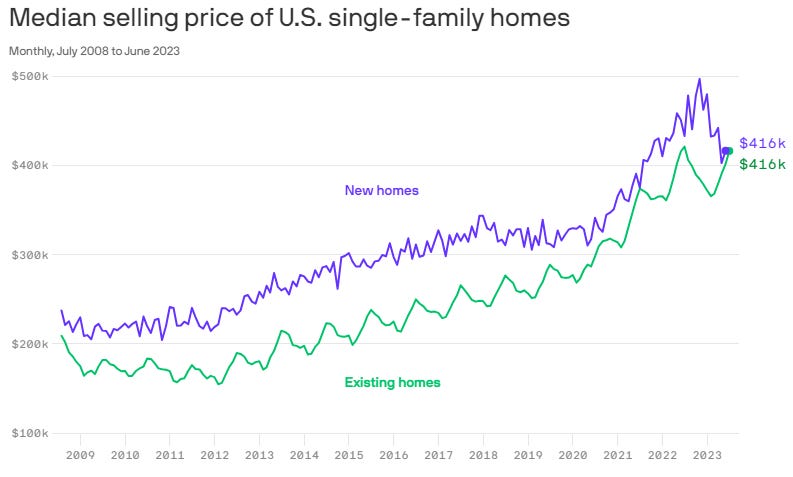
Source: https://www.axios.com/2023/07/21/new-existing-home-prices


Source: https://www.apartmentlist.com/research/national-rent-data

Source: https://twitter.com/jayparsons/status/1683844619824427014?s=20
The Manheim Used Vehicle Index is likely to be updated around the same time the NFP print, but used cars show the continuing downward trend. As summer travel winds down, rental cars are put back on the market. In addition, automobile demand has remained robust as indicated by the GDP numbers and production has ramped up as supply chains eased.

Source: https://publish.manheim.com/en/services/consulting/used-vehicle-value-index.html

Source: https://www.cargurus.com/Cars/price-trends/
On the other hand, gasoline has spiked up to finish July.
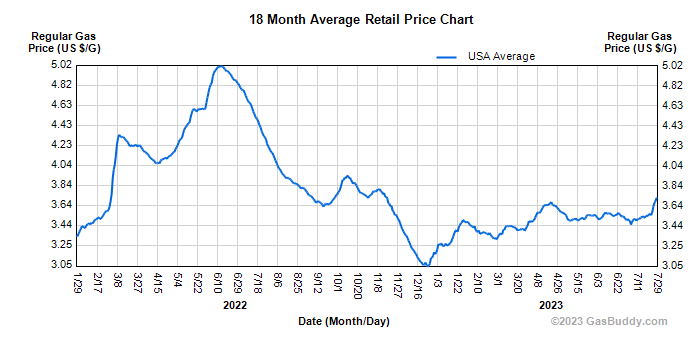
Source: https://www.gasbuddy.com/charts

Source: https://en.macromicro.me/collections/19/mm-oil-price/4376/crude-oil-cracking-spread-vs-wti
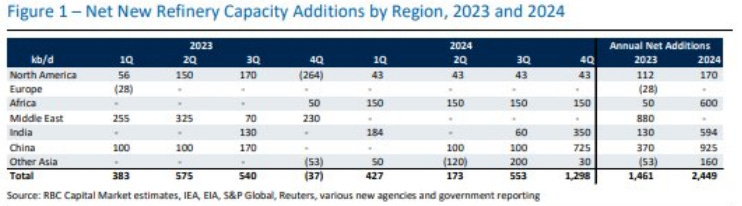
OPEC production numbers seemed to have held, but Russia exports decreased recently. Furthermore, Exxon had an unexpected refinery shutdown at their Baton Rouge facility. It’s worth reiterating there are refineries coming online this quarter.

Source: https://momr.opec.org/pdf-download/

Source: https://twitter.com/HFI_Research/status/1683541467099459585?s=20
Whether new rents and used cars offset the commodity impulse will probably determine whether the 10yr stays <4.0. Magic number is probably still 0.3 MoM. There is a chance that the market overlooks the commodity impulse if it focuses on the weight of the shelter drag. This would also provide Chair Powell confirmation that he can start focusing on supply rather than demand.
In my opinion, if the market prices this narrative, Chair Powell gains the justification to emphasize that the Fed has no control over supply, as the Fed does not have the power to repair refineries or build apartments. During the latest FOMC press conference, Chair Powell checked a few boxes for the soft landing camp:
Real rates are restrictive
Implied keeping real rates constant
Stated not aiming to raise unemployment, while noting historical precedents of restrictive monetary stance

Source: https://twitter.com/NickTimiraos/status/1684276707887308803?s=20
With that being said, if the 10yr starts trading >4.0, that will provide significant headwinds to equities. Halfway through the earnings season, the 2024/2023 estimates are approximately 245 and 218. SPY P/E is approximately 18.7x and 21x respectively. It is worth noting mid/small caps are trading <15x. Treasury Bills (Tbills) yield 18x and provide an attractive alternative to the risk averse, while the 10yr is trading around 25x.


Source: https://www.yardeni.com/pub/peacockfeval.pdf

Source: https://www.investing.com/rates-bonds/usa-government-bonds
That being said, I think people are still underestimating the risk appetite of the Buy the Dip Generation. While risk premiums have pushed into negative territory, Millennials remain undeterred.
For the “E” side of the P/E: halfway through the earnings season, most companies have provided upward guidance. Both Google and Meta implied ad spending troughs. The marketing sector is likely to be immediate beneficiaries from the emergence of LLMs as marketing becomes individualized. As companies focus on ramping up capex for LLM and automation related investments while maintaining margins, that puts downward pressure on short term wage growth. Companies just now trying to grab machine learning talent are late to the party. While that may cause some labor tightness, the net effect should be more capex vs less labor cost increases. I continue to believe that the LLMs + Code interpreter combination will provide meaningful productivity growth in the next year.

Source: https://twitter.com/JosephPolitano/status/1684905629553471488?s=20


Source: https://twitter.com/emollick/status/1673184010741096448?s=20
In summary, this market is a mere opportunity to accumulate for millennials. Millennials pulled out a compounding calculator for 30 year horizons and have been unfazed by this market. Funds that were touting cash is king have underperformed the broad market and at some point people are likely to realize they have run out of negative excuses to short or sit out the market. The narratives that have been dismissed include the following:
Labor shock was coming
Banks were failing
Credit crunch was coming
AI effects were too early to justify valuations
Debt ceiling/TGA rebuild was going to cause bond market turbulence
Earnings were/are going to disappoint
While valuations have stretched high for the overall market, the large technology companies are fundamentally different from the companies in the dotcom era and there is always opportunity to be found with them anchoring the market if nominal GDP growth is sustained and AI provides tailwinds for productivity growth in every sector. The market participants that caught the Christmas low have no reason to sell and only seek opportunities to add positions after trimming profitable trades. The 1H underweight/short positioning has forced some funds to buy at price levels they do not want to buy.
However, this changes if the 10yr trades >4.0. The push and pull between the underlying supply and demand for the long end of the yield curve is something that needs to be monitored on a week to week basis.
Inflation is rolling over faster than the economy and the latest economic data has soft landing characteristics. Whether that continues remains to be seen. The GDP print dented some of the demand for the long end, but there are still those that believe the Fed has already overtightened. Prices are trending in the right direction and it is likely that Chair Powell's goal is to hold the “right” rate for as long as possible. The closest analog to the 70s is likely labor not oil. However, wage growth has the biggest disinflationary opponent: technology. The current regime seems more like a weird combination of post WW2 and 90s.
There comes a time when the Fed’s focus may transition from dampening short term demand to not restricting longer term supply capex solutions (farms, refineries, manufacturing plants, data centers, and apartments). Furthermore, Chair Powell may decide additional hikes are no longer net restrictive and only worsen the wealth gap. That may be now.