
middle out compression (1/3)
market drivers: growth and price

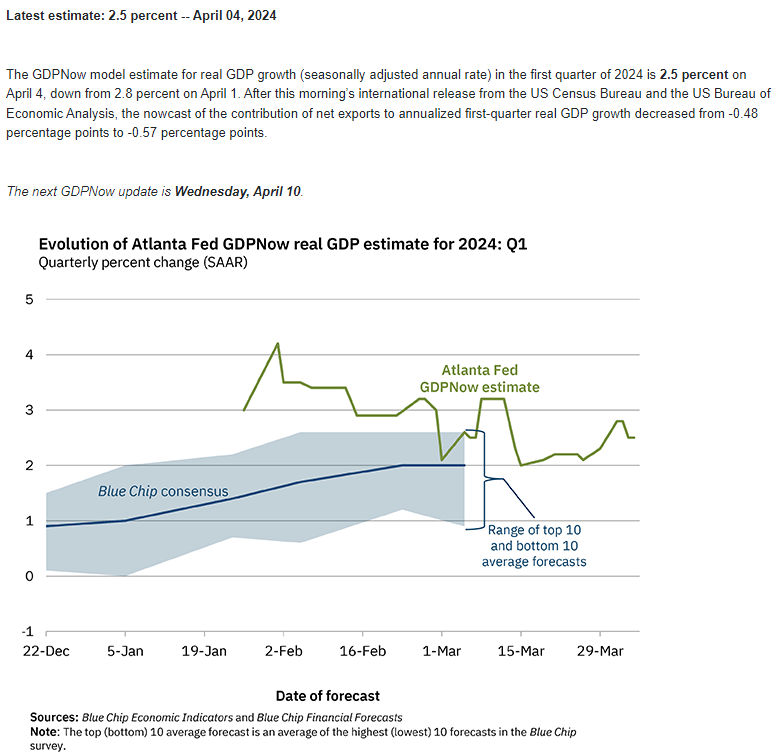
Growth

So, Q1 2024 ended in a boring market grind up and my views have not changed much since the last post. This post is is going to provide support for maintaining priors, plus I wanted to talk the NGDP and RGDP chart above. The “compression” closing the gap between NGDP and RGDP has been unsung hero of 2023. This compression tells the story of real growth, which has been driven by population and productivity growth. I will come back to this point later. It is key to note the convergence of NGDP and RGDP, another example of “this time is different.” On a longer timeframe, real GDP is shown below.


The reason I am naming this entry “Middle Out Compression” is due to my view for extrapolating productivity growth. This view also frames the following just in case you want to stop reading here:
Economy is not “late” cycle
Continued growth with disinflation (<2.5% PCE by September)
Housing disinflation offsets commodity impulse
Productivity growth bridges the gap between the current pace of wage growth and target price growth for 2024
Chair Powell has guided for the pull up of soft landing. It is unfortunate that people are still using the analogy for 2024, when the discourse should really be about “expansion”.

Here’s the recent growth/price twitter thread. I believe nominal growth is likely to slow for Q2. Despite the loud FCI crowd claims, conditions are restrictive and those folks overestimate the wealth effect for aggregate demand. FCI is essentially assets and the people with assets were/are largely insensitive to Fed Funds Rate. If anything, a couple cuts would be net restrictive to the upper quartile taking advantage of MMF. In addition, the recent monetary loosening is offset by the slowing fiscal impulse for the next couple quarters, as monetary policy takes over as the lead dancer.


In the July price post, I argued Volcker’s mistake was killing small businesses. Chair Powell has the same choice soon, as small businesses are still feeling the combined pressure from pricing power, labor/oil costs and borrow costs. Small businesses still employ ~46% of Americans and account for ~40% of GDP. In the current K shaped economy, there are still many people that feel the “compression” from monetary policy despite where the stock market is.


Price
As for inflation, I believe housing inflation continues to offset commodity impulses, even with recent unrest from the Middle East. Cracks have settled recently and gasoline levels should be stable through summer.


From Fed point of view, labor cost is more important to watch than oil cost, as wage growth continues to slow.


I would like to emphasize that in a free market with proper price discovery, supply can continue to expand to meet demand, such that competition keeps inflation under control. A few adjustment cuts facilitates sustained expansion, with net disinflation. As auto chip inventory build enables increased vehicle assemblies and battery costs undergo reduction, car prices can continue their disinflation trend. The car insurance rise is exhibiting similar characteristics to home price and owner’s equivalent rent (OER), but it does not get passed to PCE.


Current gasoline level is likely to dampen spending for lower income cohorts again (magic number is 0.2 now). Furthermore, Saudi Arabia excess capacity (relative to current quota) is likely to act as an oil price stabilizer, as additional supply comes online elsewhere. The cure for high prices is high prices, barring geopolitical escalation. One could make the argument that in the event of escalation, oil price movement would be adding “restrictiveness” to economic conditions.


For rate sensitive sectors, this rate level has been the “just right” level. As housing/rent disinflation kick into higher gear, the magic number becomes 0.2. Existing is starting to exist and putting pressure on builder margins. As <4% homes rerate to 7%, the transactions put pressure on competing new homes. Builders are attempting to maintain margin with square footage reduction, but the 7% rate is sufficient to put downward pressure on prices. An additional development is the spread between 30yr mortgage and 10yr is improving as well.


Rates affect supply and <7% is likely to be net disinflationary as it improves existing listing inventory and permits, while demand remains essentially unchanged and robust from prime leverage age cohorts. It is worth noting builders are looking at 4-5 month build times, while apartments are 12-18 months.


Ironic how keeping rates here would probably cause rents to ramp up in 2025-2026 as multi-family permits have plunged. Fortunately, there is historic construction already underway and completions will continue for another year.


It has been nice to see others starting to share the view that existing homes dampen housing price growth, as it has been quite lonely. Frankly, the Fed just needs to monitor Mike Simonsen (@mikesimonsen) weekly listing charts to know when they can cut without significant housing price appreciation. Note that June would be in line with seasonal ramp of price reductions. Some people are going to be confused when lower rates lead to lower inflation.


In addition, I have a supplementary theory that improved shelter affordability would actually act like “QT.” The recent NAR report seems to support the theory. As affordability improves for Gen Z and Millennials, consumption would be reduced elsewhere (especially in luxury and entertainment services). Boomers have begun the wealth transfer process in the form of helping with down payments.


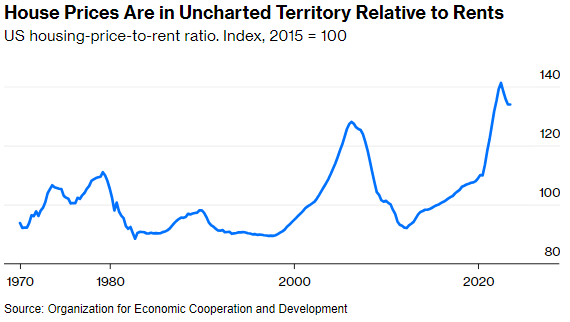
It’s worth noting that according to this report, there was a real estate preference vs stocks as an investment vehicle, despite the current home price to rent ratio. Most housing discourse disagreements are over how the price to rent gap resolves, and my lean is home prices down as record apartment supply pushes vacancies upwards, with existing home sales pressure new home prices.
Immigration has joined the discourse, for good economic reasons. I maintain that population and productivity growth dictate real growth and the long end. I continue to view immigration as net disinflationary as it provides downward force for wage growth, although it increases demand for apartments. The labor force increase changes the math for sustainable equilibrium of job growth, which moves the policy neutral point as well.


It is hard to predict future immigration with election uncertainty, but I believe the 2023 immigration burst had a combined element of US economy doing well relative to other countries and the border policies/processes that are currently being improved.


The case for full employment incentivizing efficiency gains and productivity growth is only getting stronger every quarter. The p word is “real” and I am acutely aware how hawks dismiss the idea of extrapolating productivity growth (continued supply expansion).


Maybe I am being too optimistic, but Chair Powell gave his numbers for wage growth and productivity, before GPT-4 and GLP-1. Here’s the supply thread from late November 2023.


The “compressed” labor market from boomers retiring is gearing up the economy to boom. There is a massive opportunity for “real” long term growth. The potential reward for “accepting” 2.5% (probably more like 2.3% based on 10yr breakeven and post GFC symmetry) is incredible. Focusing on short term demand would be myopic.


Conclusion
In summary, growth is still trending up but slowing as rate sensitive sectors trough while the labor market has become more balanced with immigration providing a large labor supply addition. The closest analog to the 70s is likely labor not oil. However, it has the two disinflationary opponents: immigration and technology. Meanwhile, the fiscal and monetary dance continues, with monetary policy taking the lead this time as monetary loosening offsets the slowing fiscal impulse.
Q2 earnings guidance is likely to be lower than expected for certain sectors as consumption trends shift a bit and nominal growth slows, albeit with optimistic commentary that a couple rate cuts are on the horizon. The Fed’s forecast of 2024 growth seems to be intact, as inflation trends toward target by end of year.
The magic number for Chair Powell is seeing <0.25 MoM for the next 3 months. Although there are bound to be bumps here as economic data rarely moves in a straight line, achieving <2.5% for 2024 looks like an increasingly probable scenario. I believe we are in a unique environment that has never been seen. There is no analog for the current regime, but the closest comparison is the combination of post WW2 and 90s. Now here’s the twist, the first cut is likely to impact the stock market negatively, while propping up the real economy. I believe Chair Powell follows the housing script laid out by the four previous successful tightening cycles.

